%20(1).png)
.png)
.png)
Product Adoption: Rolling Out the Red Carpet for Your Product
Product adoption is a term that you may hear being used in marketing, but what does it mean? It refers to the process of how potential customers become actual buyers. The adoption process involves three distinct steps: awareness, interest, and preference.
A prospect becomes aware of your product through advertising, content marketing, or word-of-mouth recommendations. They might go on to check out your offering on your website and consider it as a potential purchase. Finally, they may read reviews and compare your product against competitors before adopting your product and starting to use it.
Product adoption is a crucial indicator of growth. If your product isn't adopted, your business won't grow, plain and simple. Taking this into consideration, we’ll be shedding some light on everything businesses should know about effective product adoption in 2022.
Let’s start with some key product adoption metrics.
Product Adoption Metrics To Keep In Mind
Product adoption metrics are the key indicators for measuring how new product features/changes are performing. It's essential to understand them before making changes to your product because they can help you make objective decisions that positively or negatively impact your bottom line. These metrics are also crucial to understanding how successful your channel is at acquiring and retaining customers.
They can be tricky to measure, but you can get valuable insights into improving your customer base with some care and diligence. The following three product adoption metrics will help you understand where you stand with the product adoption situation:
1. Product Adoption Rate
Product adoption rate is the number of people who adopt a product within a period of time.
Product Adoption Rate = (New Active Users ÷ Signups) x 100
The adoption rate usually depends on multiple factors such as its cost, competition, and benefits. To calculate this metric, create a chart that shows how many users adopt (start using the product) the product in each month or quarter.
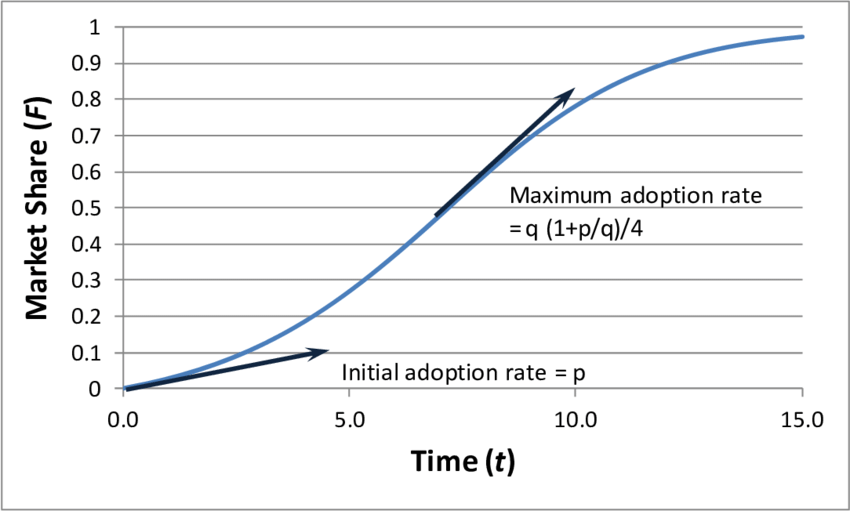
As an example, you can use the Bass diffusion model. The model consists of a differential equation that shows the process of new product adoption by the population.
2. Time-to-first key action
The Time-to-First-Key-Action metric is an essential metric for measuring the effectiveness of your content. It estimates how quickly users can reach the "first key action" after they have landed on a web page. This metric mainly focuses on the average time a new prospect or customer consumes while browsing through an existing feature. The same can be applied to existing customers who are trying out an updated or new feature.
For example, if you’ve recently added a new plugin to your website, say a chatbot plugin where customers can interact with a bot for customer service, the average time your existing customers spend on the chatbot is the time-to-first key action.
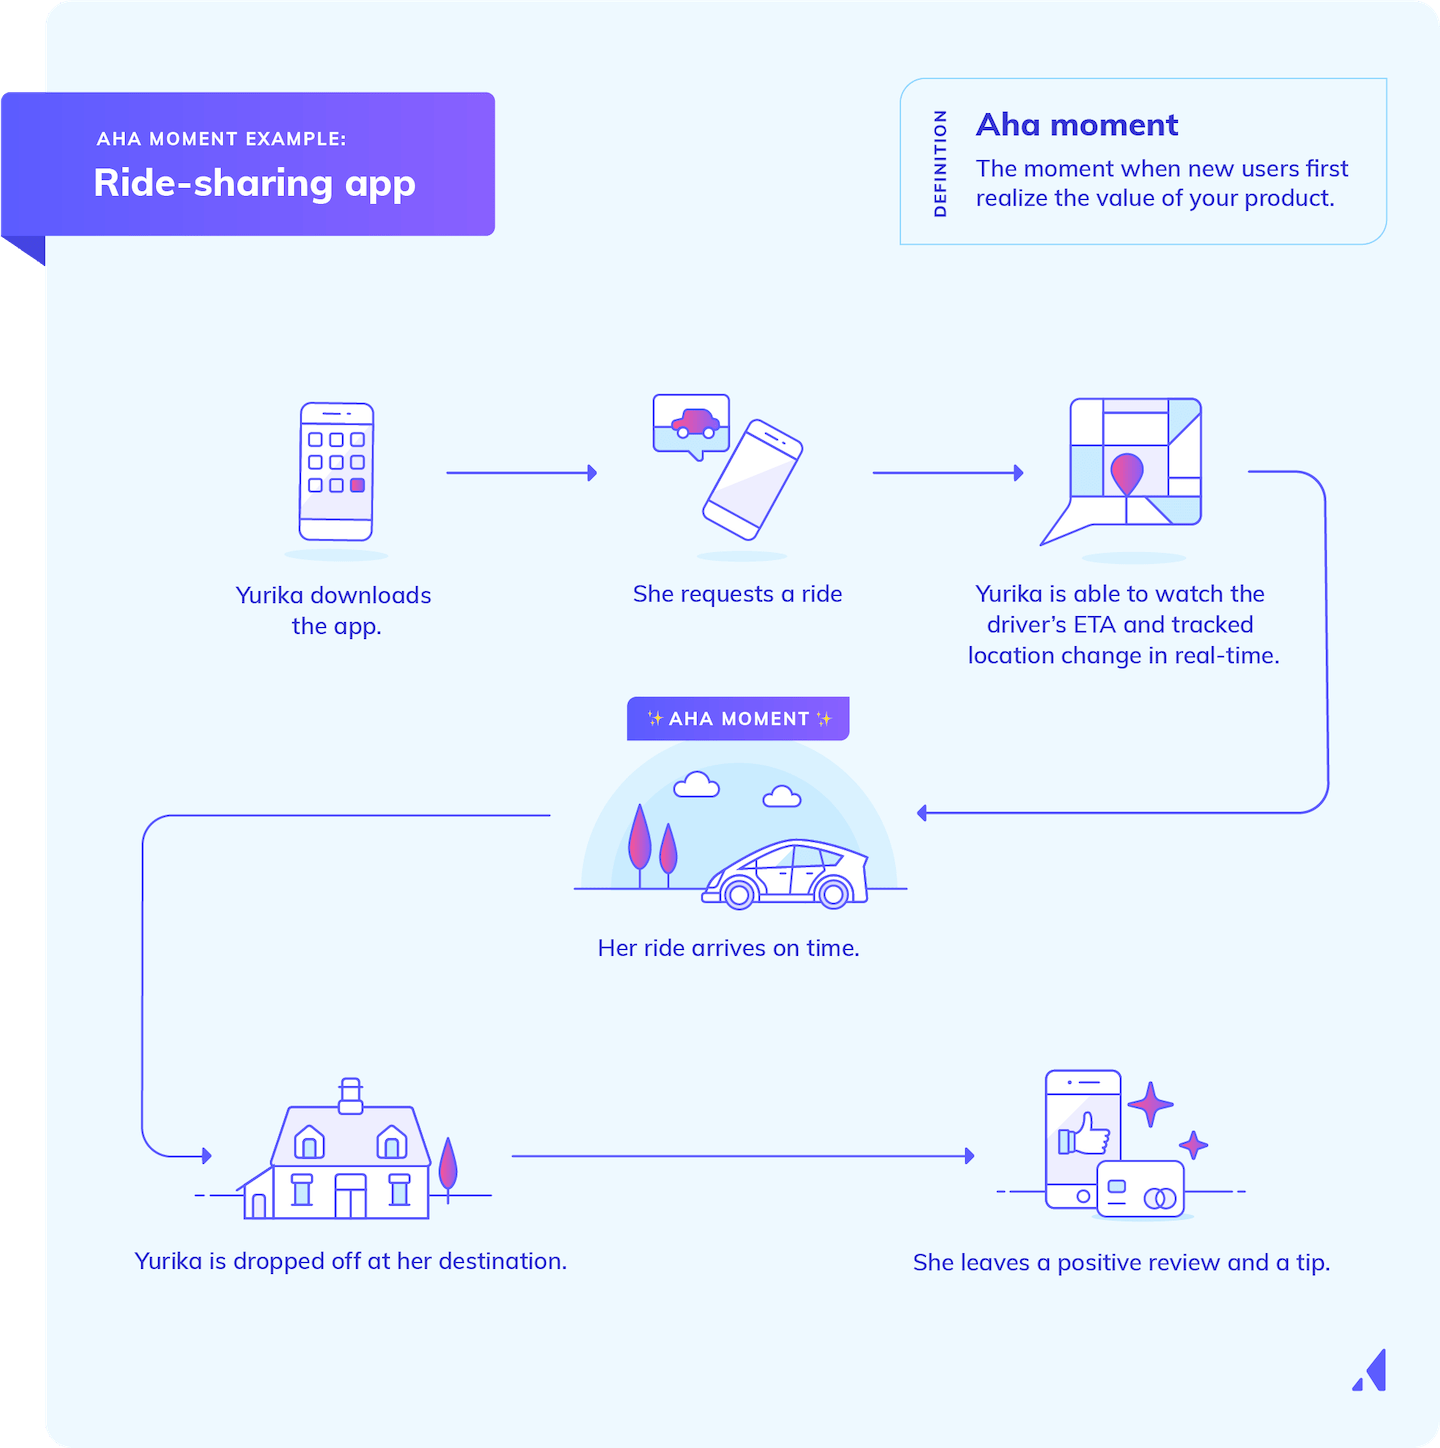
One of the most widespread and at the same time overlooked key actions is the user’s “Aha” moment. To avoid being too scientific, “Aha” moments make users realize how the product works, give them the motivation to continue to use the product, and encourage users to employ the product in their day-to-day tasks. Here’s how “Aha” moment works in ridesharing apps.
3. Percentage of users who performed a core activity for the first time
This metric is used to find the percentage of users who performed a core feature on your site for the first time. Suppose you have an ecommerce website The core feature could be adding a product to the cart or purchasing it. To monitor and measure these KPIs, you can utilize tools to assess the new user onboarding funnel and analyze the steps where users are having problems. Tools like Woopda and Mixpanel that are used to measure analytics can come in handy if you’re seeking to measure product adoption.
🚀Here are top 30 tools that will help you visualize product adoption and measure your success.🚀
Now that you have a better understanding of important product adoption metrics to keep in mind, let’s dive into the different stages that are involved during product adoption.
Different Stages Involved During Product Adoption
One of the key factors in launching a new product is the product adoption curve. The product adoption curve represents the level of interest among different groups in trying your products over time.
Knowing your product adoption curve makes it much easier to plan a marketing strategy that will succeed. You also gain insights into who is most likely interested in what stage of the lifecycle and how you can reach out to them through specific strategies for each phase (such as emailing current users or prospects at different points).
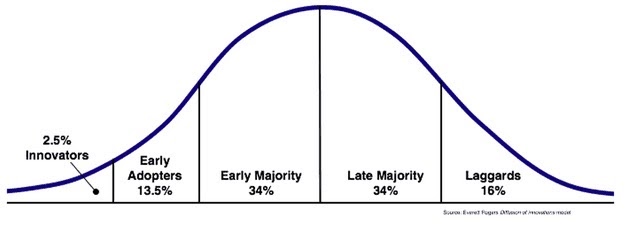
Product adoption entails five stages, each of which can be applied to a multitude of products, including SaaS products.
Introduction Stage
The Introduction Stage, also known as the awareness or knowledge stage, is the initial stage of product acceptance. A prospect stumbles across your product and wants to learn more because they don't know enough about it yet. It’s your responsibility to give clarity to customers regarding the issues involved in the product and raise brand awareness. Assist them with a smooth onboarding process and a positive first impression.
The Information-gathering Stage
The Information-gathering stage is the second stage, where customers seek out additional information about products they are interested in. Ensure that you have a well-functioning help center and customer service in place to address any inquiries a potential consumer might have regarding your product or service.
The Consideration Stage
During the Consideration Stage, customers decide whether or not a product is worth trying. This is precisely why this stage is commonly referred to as the ‘decision’ stage as well. While examining a product, prospects will compare it to its rivals or other products they’ve researched. In this stage, companies need a clear message for the product’s target audience and how it differs from its alternatives.
🚀We explained how to perform competitor research and identify your value proposition. 🚀
Prospects shouldn’t need to think about whether they’re the ideal consumer or not. The product should solve this dilemma right away.
The Sampling Stage
Also referred to as the ‘implementation’ stage, the Sampling Stage is a phase where customers test products and evaluate whether they will meet their requirements or not. The Sampling Stage is when prospects are convinced with the product's value proposition and are willing to try it out for a limited time or in a limited capacity. Free trials and money-back guarantees can entice a potential customer to try out your offering with little hesitation.
The Buy or not Buy Stage
At this point, the prospect's trial is over, and it's time to make a final decision. The customers will decide whether your offering gives the value they are looking for or not. Customers move from a cognitive state (being aware and informed) to an emotional state (liking and preferring) and eventually to a behavioral state in the final step of the new product adoption process (purchasing and committing long-term).
To leverage product adoption metrics effectively, businesses need to be thorough with the above-mentioned stages before proceeding with execution. Moreover, if these metrics are tracked and analyzed correctly, companies can make data-driven decisions on allocating their marketing resources.
5 Factors that influence the adoption process of new products
To successfully evaluate the potential of a new product or service, you should benchmark the benefits provided by the invention against the following five criteria. These will help reveal potential adoption barriers and areas for improvement.
Factor #1: Relative Advantage
The relative advantage refers to how much a new product or service appears to be superior to existing alternatives. Comparative advantage is critical because a new product is rarely successful without having some unique advantages over its alternatives. When an innovation is thought to be superior to the alternative solution it replaces, it will be adopted more often. It could evaluate the proportional benefit in terms of money, but it could also be a matter of convenience or status.
Factor #2: Compatibility
Your product should fit the lifestyle of your target market. Compatibility determines if the invention is compatible with the dominant set of norms, values, and other cultural or religious beliefs of the people.
Factor #3: Complexity
Complexity refers to how challenging an innovation is perceived to be of use in real life. Users must be able to utilize your product with ease. A product’s value drastically depends on how useful it is to its consumer.
Factor #4: Trialability
Trialability refers to trying out an idea on a small scale, just like a free trial. It lowers the barriers to product adoption for customers. Trialability can help persuade folks who are risk-averse and would put off using the technology because they are unsure if it will meet their needs or be better than the current practice.
Factor #5: Observability
Observability refers to a product’s visibility in the market. Since great innovations often advertise for themselves, innovations with a lower degree of observability will spread more slowly than others. This could be products that have been given less shelf space at households or offices compared to other products. For example, apparel that’s newly launched in the market but due to poor design or material quality, stores don’t place the product at their best-lighted, prominent shelves.
Important User Adoption Practices for Effective Product Adoption
Anyone in the software business space would know that user adoption strategy and product adoption success go hand in hand. The reason is simple; if you want to create a product that people want to use long-term, it is essential to have a well-thought-out user onboarding strategy, so they start on the right foot. Upon becoming customers, your users should immediately and easily understand how to make the most of your product’s various features and benefits.
However, most entrepreneurs overlook this, and as a result, end up missing out on opportunities that are right within their grasp. Here are a couple of effective user adoption best practices to keep in mind.
Build a great onboarding experience
New customers are not necessarily going to be regular customers, and numerous businesses fail to understand the same. Without a solid onboarding plan, converting new customers into ‘forever’ customers is unlikely. And so, building an interactive walkthrough is a must.
Interactive walkthroughs are on-screen guides that are utilized by businesses to introduce new products and features to end-users. Quickstart guides and hands-on training programs are typically included in interactive walkthroughs.
For example, here’s how Evernote demonstrates its procedures and guides users through the product using simple GIFs.

Offer helpful content and proactive support
A solid product onboarding strategy also comprises the following two competencies:
- Contextual Educational Content: Businesses need to offer top-notch content in a variety of formats, such as knowledge base guides, FAQs, and videos for end-users to benefit completely.
- Contextual Communication: Be available for your users when they need you in the form of proactive live chat support and onboarding emails.
Ahrefs does an outstanding job by creating tons of educational content that promotes their product at the same time. The company’s YouTube channel is filled with tips and best practices for users of their software, SEO specialists, and marketing officers.
Here’s one of the company's videos on YouTube SEO:
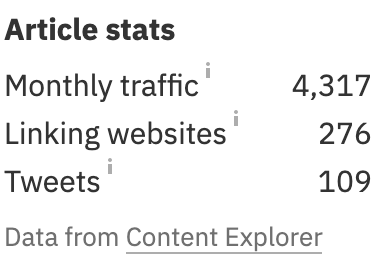
Besides, Ahrefs team also runs a blog with insightful articles on their product that bring them an impressive amount of monthly leads. Each blog post shows the monthly traffic generated by the content piece itself.
Bottom Line
To maintain a strong position in today's competitive market, organizations must harness all the resources they can to create a more engaging product adoption strategy.
We hope the information and best practices discussed in this post point you in the right direction with your product adoption strategy in 2022.

500+ data sources under one roof to drive business growth. 👇


%20(1).png)
%20(1).png)
%20(1).png)
%20(1).png)
.png)


